


News & Exhibitions
Latest Factory Updates, Industry Trends & Global Exhibition Information
Automatic CNC Nesting Machines: Calculating Material Yield and Labor Savings
A capital request for an automatic CNC nesting machine should begin with two numbers that can be traced to daily production: usable panel area recovered from each sheet and paid labor hours removed from the cutting process. Feed rate, spindle power, and a fast loading cycle matter, but they do not by themselves establish a return. A machine that cuts quickly while producing poor layouts, excessive offcuts, or repeated setup interruptions can consume much of its apparent advantage.
The cost model should separate material yield from labor productivity before combining them. Material is often the largest recurring variable in panel furniture production, while labor savings depend heavily on the current workflow: whether panels are manually measured, sawn in batches, labeled at a separate station, or moved repeatedly between machines. Treating all savings as one estimate makes it difficult to identify where an expected return is actually coming from.
Start with usable yield, not the nesting percentage alone
Nesting software commonly reports a percentage of sheet area assigned to parts. That figure is useful, but it is not the same as usable material yield. A layout can show a high nesting rate while leaving strips that are too narrow, irregular, damaged, or inconvenient to store for later work. The financial calculation needs to distinguish between theoretical leftover area and offcuts that will genuinely be consumed in a future job.
A practical yield calculation starts with the net sheet area and deducts the area that cannot become saleable parts. For each material type and thickness, record the following over a representative production period:
- Sheets issued to the cutting cell, including replacement sheets brought in after a nesting error or damaged face.
- Finished parts accepted at the next operation, measured by their programmed area rather than their bounding rectangles.
- Reusable remnants retained under a defined minimum size and identified by material, thickness, color, and location.
- Waste generated by trim margins, saw kerf or router-tool diameter, hold-down allowances, rejected parts, and unusable offcuts.
The basic measure is:
Material yield = (accepted part area + verified reusable remnant area) / total sheet area issued
For investment comparison, the remnant portion should be valued conservatively. A large rectangular offcut from a common white melamine board may have a credible future use. A narrow piece of a low-volume decorative surface should be treated as waste unless its reuse is documented in the production plan. Assigning full value to every leftover piece is one of the most common ways to overstate nesting savings.
Kerf and tool clearance deserve particular attention. A panel saw and a router do not consume material in the same pattern. With routing, the cutter diameter, inside-corner relief, tabs, onion-skin allowances, and perimeter finishing passes affect the real spacing between components. Small gaps multiplied across a dense nest can noticeably change part count per sheet. The nesting parameters used for evaluation must match the cutter sizes and machining strategy intended for production, rather than an idealized software demonstration.
Part geometry has equal influence. Rectangular cabinet sides and shelves often nest efficiently; shaped gables, curved doors, sink cutouts, and grain-matched decorative panels introduce constraints that reduce layout freedom. A quoted yield based mainly on rectangular parts should not be used to forecast a product mix dominated by irregular shapes. The correct comparison uses actual cut lists from orders or a stable historical mix, including the difficult parts that create awkward remnants.
Convert sheet savings into a defensible material value
Once yield is measured, calculate the material effect at the sheet level rather than applying a percentage improvement to total purchasing spend. Different boards have different costs, dimensions, surface quality requirements, and reuse potential. MDF, particleboard, plywood, compact laminate, and finished decorative boards should be evaluated separately. Combining them into one average sheet price can distort the result when expensive material represents only a small share of the cutting volume.
A clear approach is to compare the sheets required for the same accepted part list under the current process and under the proposed nesting process:
Material saving per production period = (current sheets required - proposed sheets required) x landed cost per sheet
Landed cost should include more than the invoice price when those additions are material to the operation. Freight, protective packaging, internal handling losses, and waste-disposal charges can be assigned where records support them. Do not add speculative values for avoided stockouts, quality reputation, or future volume growth. Those effects may be real, but they should be assessed separately from the direct yield calculation.
The comparison must hold the output constant. If the proposed machine produces more parts because output has risen, total material spending may increase even while consumption per cabinet or per order declines. The useful metric is material used per defined unit: per cabinet set, per square meter of accepted panels, or per production batch. This prevents a higher volume from being mistaken for reduced waste.
Yield losses that nesting software cannot solve alone
Optimization cannot recover material lost before the sheet reaches the table. Bowed panels, chipped edges, moisture-related movement, surface defects, and incorrect board identification can force manual rejection or cause nested parts to fail downstream. A machine evaluation should inspect the board-loading and vacuum-hold-down conditions alongside the nesting algorithm. If a panel shifts because vacuum zones do not match the sheet size or porous material is not sealed effectively, the resulting scrap is a process-control issue, not a layout issue.
Grain direction is another boundary. Rotatable parts increase nesting freedom, but doors, veneer-faced panels, and visually matched components may only be cut in one orientation. The same applies to surface patterns and protective-film direction. Confirm that the programming workflow carries these restrictions from drawing or order data into the nesting software. A yield figure obtained by freely rotating grain-sensitive parts is not available in actual production.
Labor savings come from removed touches and waiting time
Labor savings are often overstated by multiplying the headcount near a cutting area by an assumed reduction percentage. The better method is a time study that follows a batch from material release to labeled parts ready for the next operation. Record productive cutting time, manual setup, sheet handling, labeling, sorting, machine attendance, rework, and queue time separately.
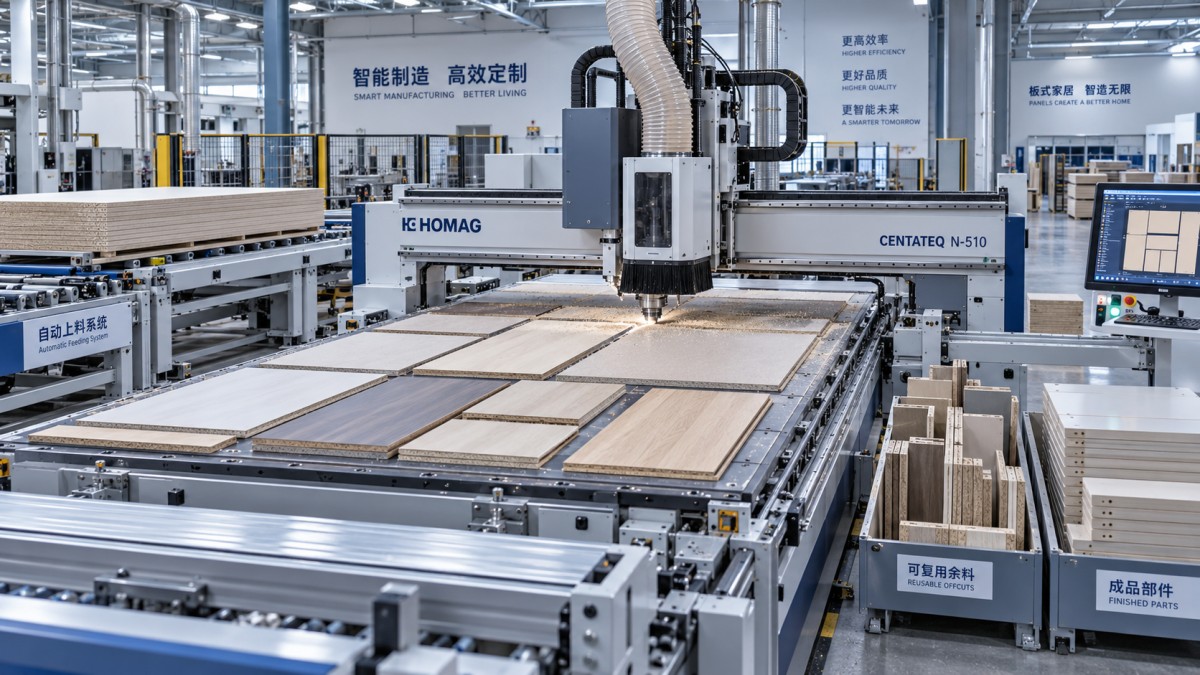
An automatic CNC nesting machine can reduce manual work through several mechanisms: automatic sheet loading, barcode-driven program selection, drilling and routing in one cycle, printed labels, and organized unloading. The value of each mechanism depends on what it replaces. A shop already using a beam saw with automatic loading may see limited improvement in raw sheet handling, while a process based on manual saw cutting, template routing, and handwritten labels has more manual touches to remove.
Use elapsed time and labor content differently. A nesting cell may shorten total batch lead time but still require an attendant during loading and unloading. Conversely, automated loading can reduce direct handling hours while the overall lead time remains constrained by edge banding or assembly. Labor savings should reflect hours genuinely released from the process or redeployed to measurable production work. Counting unattended spindle time as eliminated labor produces a misleading result.
Shift structure also changes the calculation. A machine that allows an existing team to complete the same volume within normal hours may avoid overtime; that is a measurable benefit if overtime is a recurring and documented expense. If output remains unchanged and staffing cannot be reduced or reassigned, the direct payroll effect may be limited even though workflow becomes less physically demanding. Keep those outcomes separate.
Use stable assumptions for the operating-cost comparison
Material and labor gains need to be set against the costs introduced by the new cutting process. Tooling is especially easy to underestimate. Nested-based routing uses compression cutters, downcut or upcut tools, drills, and possibly aggregate heads according to material and machining needs. Tool life is affected by board abrasiveness, chip evacuation, spindle settings, cutting depth, and the presence of laminate or adhesive layers. A cost model should use observed tool consumption from comparable routing work, then revise it after commissioning data is available.
Include electricity, compressed air where applicable, vacuum-pump demand, dust extraction capacity, scheduled maintenance, software subscriptions or support arrangements, and spare consumables. These expenses should be compared against the current cutting equipment's real operating costs, not treated as entirely new costs. A vacuum pump may require substantial power, yet eliminating several separate machines and their idle time changes the total picture.
Installation conditions can alter both output and cost. The machine footprint is only one part of the requirement. Sheet infeed and outfeed paths, forklift access, vacuum-pump location, dust-collection ducting, electrical supply, and room for sorting components all affect the achievable cycle. Restricted unloading space creates a hidden bottleneck: the machine finishes the nest, but operators cannot clear parts and prepare the next sheet without interruption. The layout should be reviewed using the largest panel size and the most complex expected nest, rather than an empty-floor drawing.
Build the payback model around a common production basis
A concise annual model can be built from production records without inventing a forecast. Select a representative period that includes normal product variation, then annualize only when workload is stable enough to support it. Calculate direct material savings from sheet reduction, direct labor savings from released hours, and recurring operating-cost changes. Set these against the installed investment, including machine, loading or unloading equipment, tooling, site preparation, training time, and integration work that is necessary to start production.
Net annual benefit = material savings + verified labor savings + documented overtime reduction - added annual operating costs
Simple payback period = installed investment / net annual benefit
This equation is deliberately simple. It makes the assumptions visible and allows alternative scenarios without disguising weak inputs in a complex financial model. Create a base case using current production records, then test the assumptions that have the largest effect: material yield, utilization of labor hours released, tooling consumption, and the share of work that is suitable for nesting. A result that remains acceptable when yield improvement is lower than expected is more credible than one dependent on perfect layouts and full utilization from the first week.
Capacity should be considered separately from savings. Additional throughput has value only when there is sufficient demand and downstream operations can absorb it. If edging, drilling, finishing, or assembly already limits output, faster nesting may create a larger queue rather than more finished furniture. The production route after cutting must be timed before assigning revenue or margin to added machine capacity.
Validate the calculation with representative production files
The most useful technical comparison uses real job data, not a generic demonstration nest. Supply a varied set of cut lists that includes common cabinet parts, small parts, large panels, grain-sensitive items, and any recurring complex shapes. For each file, document the material, thickness, sheet size, cutter specification, required operations, and quality restrictions. Run the same inputs through the proposed programming rules and compare the result against current sheets issued and accepted parts produced.
Observe more than the screen layout. Confirm the time required to import data, prepare the program, load a sheet, machine the nest, label parts, remove components, handle offcuts, and recover from a tool change or sheet defect. These details reveal whether the modeled labor reduction can be repeated across shifts. They also expose programming dependencies that may require disciplined data preparation before the machine delivers its expected yield.
A sound investment decision does not require claiming one universal savings figure. It requires a traceable link between actual part demand, material behavior, work content, and the conditions of the intended installation. When those inputs are measured consistently, the value of nesting is visible in fewer sheets consumed, fewer manual touches, and a cost model that remains useful after the machine enters production.
Send Your Inquiry
We welcome your cooperation and we will develop with you.